|
|

原文链接:
https://www.kaggle.com/code/sivahemang/fifa-world-2022-analysis-and-prediction/notebook
2022卡塔尔足球世界杯

2022年卡塔尔世界杯(英语:FIFA World Cup Qatar 2022)是第二十二届世界杯足球赛,是历史上首次在卡塔尔和中东国家境内举行、也是第二次在亚洲举行的世界杯足球赛。除此之外,卡塔尔世界杯还是首次在北半球冬季举行、首次由从未进过世界杯的国家举办的世界杯足球赛。
揭幕战将于当地时间11月20日19时(北京时间11月21日0时)进行,由东道主卡塔尔对阵厄瓜多尔,决赛将于当地时间12月18日18时(北京时间12月18日23时)在卢塞尔球场进行。
世界杯是所有足球迷们的盛宴,更是所有球员们梦想的舞台,每支参赛队都怀着冠军梦想而来,但冠军队伍只有一支,32支球队64场比赛,谁将最终问鼎大力神杯?
我们看到已经有不少知名博主和自媒体根据经验做出自己的预测,本次小编也来凑凑热闹,通过分析历史数据并使用SmartNoteBook建模,实现从数据科学的角度来预测一下本届世界杯的冠军球队。
卡塔尔世界杯32强名单
A组:卡塔尔、厄瓜多尔、塞内加尔、荷兰
B组:英格兰、伊朗、美国、威尔士
C组:阿根廷、沙特阿拉伯、墨西哥、波兰
D组:法国、澳大利亚、丹麦、突尼斯
E组:西班牙、哥斯达黎加、德国、日本
F组:比利时、加拿大、摩洛哥、克罗地亚
G组:巴西、塞尔维亚、瑞士、喀麦隆
H组:葡萄牙、加纳、乌拉圭、韩国
话不多说,开始我们的预测~
冠军球队预测
采用的数据集:
1872年至2022年国际足球成绩:
- shootouts.csv
- results.csv
国际足联世界排名1992-2022
- fifa_ranking-2022-10-06.csv
2022年国际足联世界杯分组
- Fifa_Worldcup_2022_Groups.csv
引入所需包:
import numpy as np
import pandas as pd
import matplotlib.pyplot as plt
%matplotlib inline
import seaborn as sns
from plotly.offline import download_plotlyjs, init_notebook_mode, plot, iplot
import plotly.graph_objs as go
import plotly.figure_factory as ff
import plotly.express as px
from datetime import datetime
import warnings
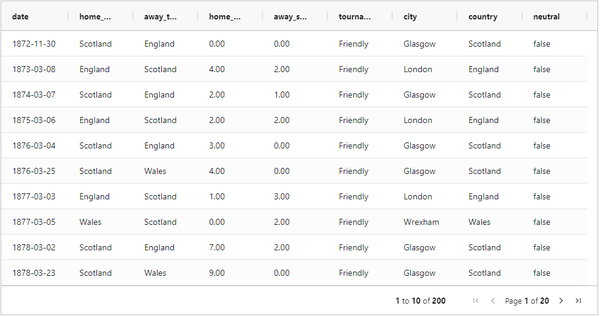
import plotly.graph_objs as go导入历史对阵成绩数据:
df = pd.read_csv("/home/results.csv")
df
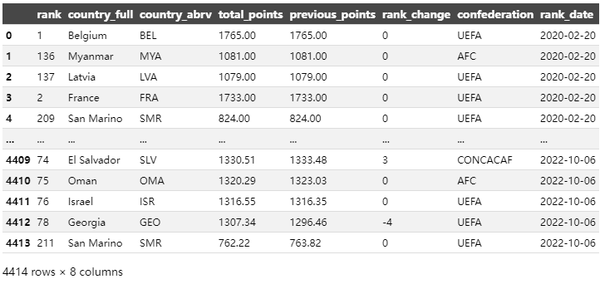
导入历史排名数据,并对rank_date做变换和筛选:
rank = pd.read_csv('/home/fifa_ranking-2022-10-06.csv')
rank["rank_date"] = pd.to_datetime(rank["rank_date"])
rank = rank[(rank["rank_date"] >= "2020-1-1")].reset_index(drop=True)
简单的数据处理和清洗:
rank["country_full"] = rank["country_full"].str.replace("IR Iran", "Iran").str.replace("Korea Republic", "South Korea").str.replace("USA", "United States")
rank = rank.set_index(['rank_date']).groupby(['country_full'], group_keys=False).resample('D').first().fillna(method='ffill').reset_index()
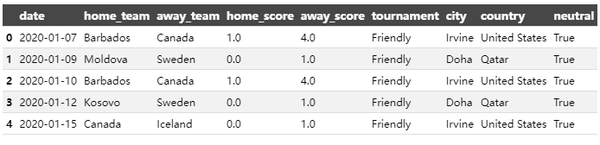
df["date"] = pd.to_datetime(df["date"])
df = df[(df["date"] >= "2020-1-1")].reset_index(drop=True)
df.head()
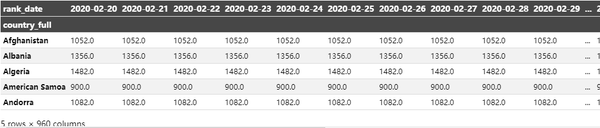
数据转换透视表:
ranking_df = pd.pivot_table(data = rank,
values = 'total_points',
index = 'country_full',
columns = 'rank_date').fillna(0.0)
ranking_df.head()
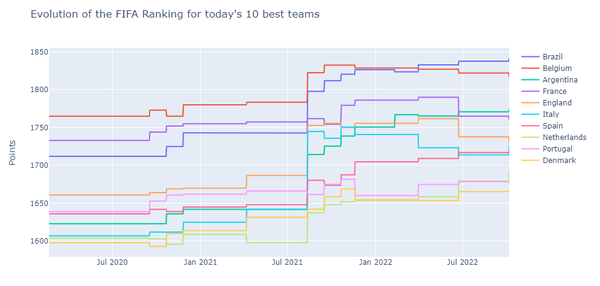
当今10支最佳球队的国际足联排名的演变:
best_ranks = ranking_df.loc[ranking_df['2022-10-06'].sort_values(ascending = False)[:10].index]
fig = go.Figure()
for i in range(len(best_ranks.values)):
fig.add_trace(go.Scatter(x = best_ranks.columns,
y = best_ranks.iloc,
name = best_ranks.index))
fig.update_layout(
title="Evolution of the FIFA Ranking for today\'s 10 best teams",
yaxis_title="Points"
)
fig.show()
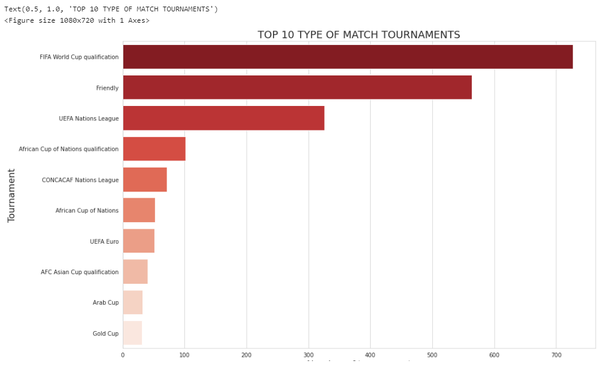
十大足球比赛的类型:
tournament = df['tournament'].value_counts()
tournament = tournament[:10]
plt.figure(figsize = (15,10))
sns.set_style("whitegrid")
ax = sns.barplot(y=tournament.index, x=tournament.values, palette="Reds_r", orient='h')
ax.set_ylabel('Tournament', size=16)
ax.set_xlabel('Number of tournament', size=16)
ax.set_title("TOP 10 TYPE OF MATCH TOURNAMENTS", fontsize=18)
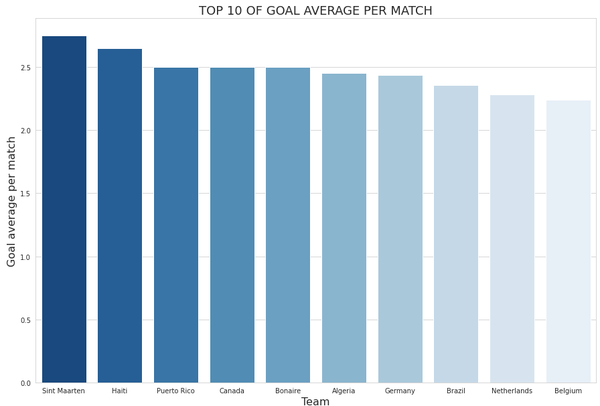
场均进球数前10名的球队:
home = df[['home_team', 'home_score']].rename(columns={'home_team':'team', 'home_score':'score'})
away = df[['away_team', 'away_score']].rename(columns={'away_team':'team', 'away_score':'score'})
team_score = home.append(away).reset_index(drop=True)
country_info = team_score.groupby('team')['score'].agg(['sum','count','mean']).reset_index()
country_info = country_info.rename(columns={'sum':'nb_goals', 'count':'nb_matches', 'mean':'goal_avg'})
plt.figure(figsize = (15,10))
sns.set_style("whitegrid")
plt_data = country_info.sort_values(by='goal_avg', ascending=False)[:10]
ax = sns.barplot(x="team", y="goal_avg", data=plt_data, palette="Blues_r")
ax.set_xlabel('Team', size=16)
ax.set_ylabel('Goal average per match', size=16)
ax.set_title("TOP 10 OF GOAL AVERAGE PER MATCH", fontsize=18)
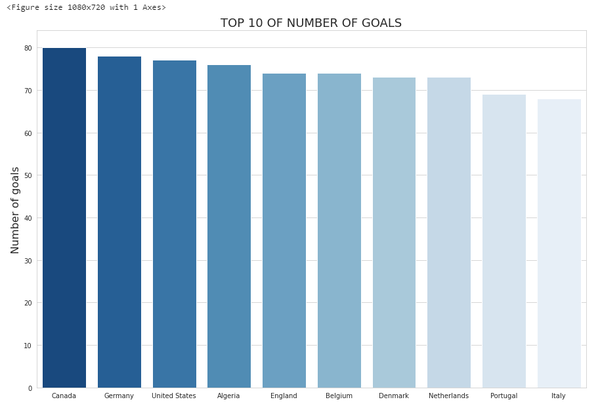
进球数前10名的球队:
plt.figure(figsize = (15,10))
sns.set_style("whitegrid")
plt_data = country_info.sort_values(by='nb_goals', ascending=False)[:10]
ax = sns.barplot(x="team", y="nb_goals", data=plt_data, palette="Blues_r")
ax.set_xlabel('Team', size=16)
ax.set_ylabel('Number of goals', size=16)
ax.set_title("TOP 10 OF NUMBER OF GOALS", fontsize=18)
del plt_data, country_info
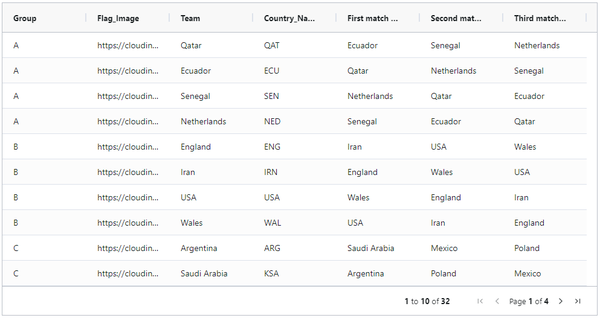
导入卡塔尔世界杯的分组对阵数据:
world_cup = pd.read_csv("/home/Fifa_Worldcup_2022_Groups.csv")
world_cup
简单的数据处理和清洗:
world_cup = world_cup.replace({"Korea Republic" : "South Korea","USA": "United States"})
world_cup = world_cup.set_index('Team')与rank表进行关联:
- home_team:主队
- away_team:客队
df = df.merge(rank,left_on=['date', 'home_team'],right_on=['rank_date', 'country_full'])
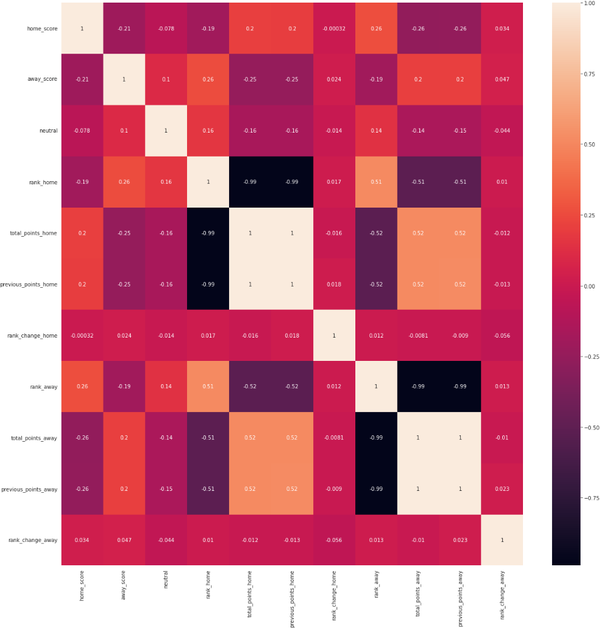
df = df.merge(rank, left_on=['date', 'away_team'], right_on=['rank_date', 'country_full'], suffixes=('_home', '_away')) 查看df所有特征变量的相关性:
fig, ax = plt.subplots()
fig.set_size_inches(20, 20)
corr1 = df.corr()
corr1
sns.heatmap(corr1,annot=True)
数据变换和特征处理:
df['rank_difference'] = df['rank_home'] - df['rank_away']
df['average_rank'] = (df['rank_home'] + df['rank_away'])/2
df['point_difference'] = df['total_points_home'] - df['total_points_away']
df['score_difference'] = df['home_score'] - df['away_score']
df['is_won'] = df['score_difference'] > 0
df['is_stake'] = df['tournament'] != 'Friendly'
df['wc_participant'] = df['home_team'] * df['home_team'].isin(world_cup.index.tolist())
df['wc_participant'] = df['wc_participant'].replace({'':'Other'})
df = df.join(pd.get_dummies(df['wc_participant']))导入机器学习所需的包:
from sklearn import preprocessing
from sklearn.model_selection import train_test_split
from scipy import stats
from sklearn.linear_model import LogisticRegression
from collections import Counter
from sklearn.metrics import confusion_matrix
from sklearn.metrics import accuracy_score, f1_score
from xgboost import XGBClassifier
from sklearn.ensemble import RandomForestRegressor
from sklearn.naive_bayes import BernoulliNB
from sklearn.naive_bayes import GaussianNB
from sklearn.svm import SVC
from sklearn.ensemble import RandomForestRegressor
import warnings拆分数据集:
X, y = df.loc[:,['average_rank', 'rank_difference', 'point_difference', 'is_stake']], df['is_won']
X_train, X_test, y_train, y_test = train_test_split(
X, y, test_size=0.2, random_state=42)定义一个画ROC曲线的函数plot_roc_cur:
def plot_roc_cur(fper, tper):
plt.plot(fper, tper, color='orange', label='ROC')
plt.plot([0, 1], [0, 1], color='darkblue', linestyle='--')
plt.xlabel('False Positive Rate')
plt.ylabel('True Positive Rate')
plt.title('Receiver Operating Characteristic (ROC) Curve')
plt.legend()
plt.show()定义一个支持跑多个模型的函数run_model:
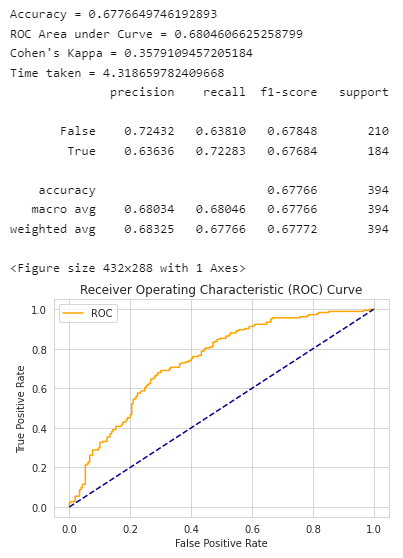
通过run_model可以训练模型,并且打印和输出模型的效果评估指标,比如模型的准确率、混淆矩阵、ROC曲线以及时间消耗等等。(关于模型评估指标可以参考小编之前的文章《聊聊机器学习分类问题常用的评价指标》)
import time
from sklearn.metrics import accuracy_score, roc_auc_score, cohen_kappa_score, plot_confusion_matrix, roc_curve, classification_report
def run_model(model, X_train, y_train, X_test, y_test, verbose=True):
t0=time.time()
if verbose == False:
model.fit(X_train,y_train, verbose=0)
else:
model.fit(X_train,y_train)
y_pred = model.predict(X_test)
accuracy = accuracy_score(y_test, y_pred)
roc_auc = roc_auc_score(y_test, y_pred)
coh_kap = cohen_kappa_score(y_test, y_pred)
time_taken = time.time()-t0
print("Accuracy = {}".format(accuracy))
print("ROC Area under Curve = {}".format(roc_auc))
print("Cohen's Kappa = {}".format(coh_kap))
print("Time taken = {}".format(time_taken))
print(classification_report(y_test,y_pred,digits=5))
probs = model.predict_proba(X_test)
probs = probs[:, 1]
fper, tper, thresholds = roc_curve(y_test, probs)
plot_roc_cur(fper, tper)
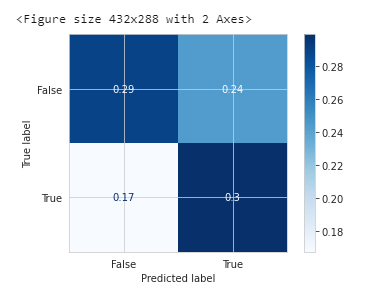
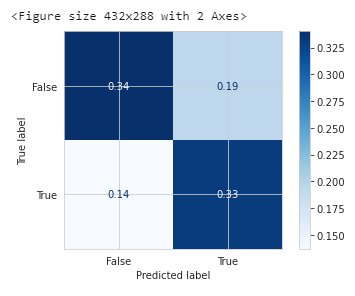
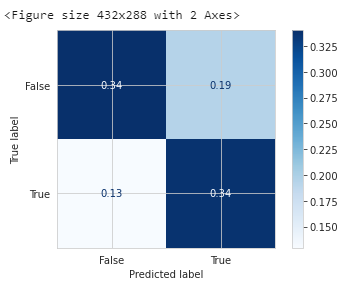
plot_confusion_matrix(model, X_test, y_test,cmap=plt.cm.Blues, normalize = 'all')
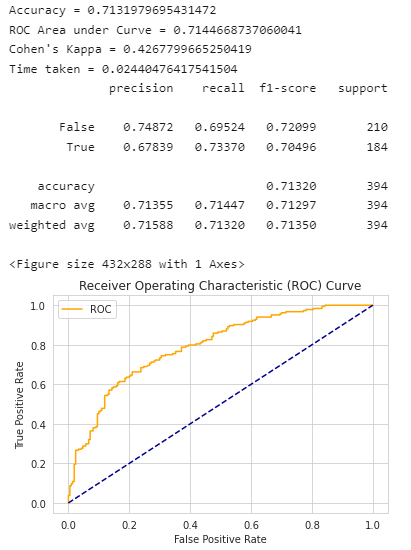
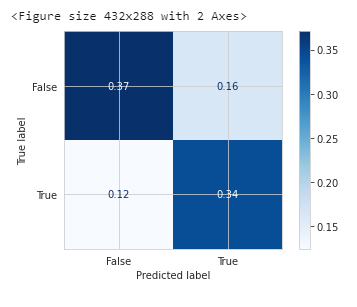
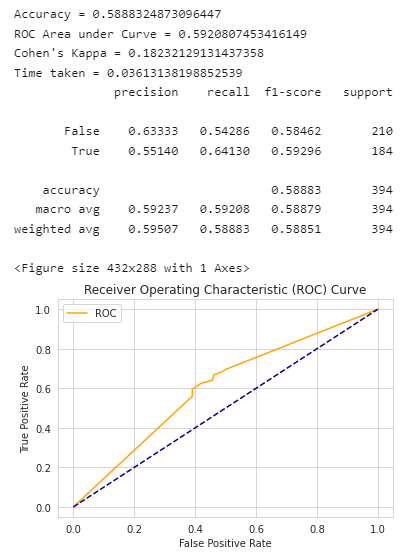
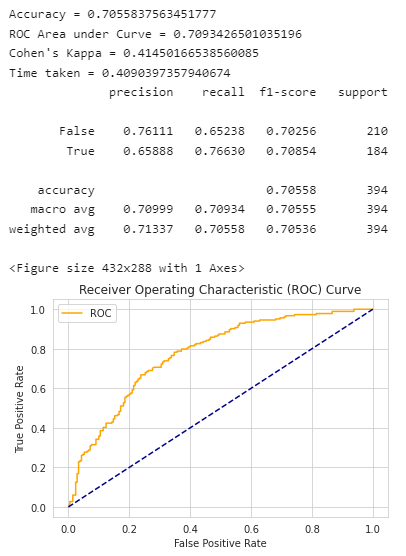
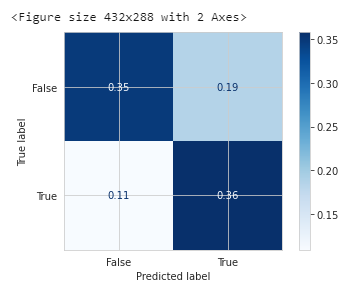
return model, accuracy, roc_auc, coh_kap, time_taken逻辑回归的效果评估:
from sklearn.linear_model import LogisticRegression
params_lr = {'penalty': 'l1', 'solver':'liblinear'}
model_lr = LogisticRegression(**params_lr)
model_lr, accuracy_lr, roc_auc_lr, coh_kap_lr, tt_lr = run_model(model_lr, X_train, y_train, X_test, y_test)
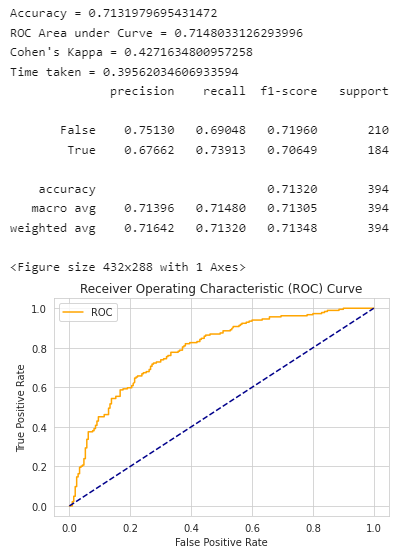
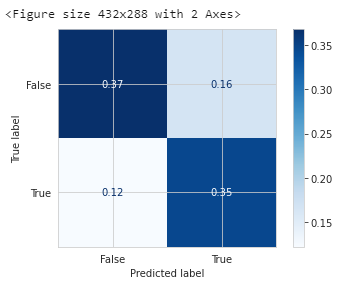
决策树的效果评估:
from sklearn.tree import DecisionTreeClassifier
params_dt = {'max_depth': 16,
'max_features': "sqrt"}
model_dt = DecisionTreeClassifier(**params_dt)
model_dt, accuracy_dt, roc_auc_dt, coh_kap_dt, tt_dt = run_model(model_dt, X_train, y_train, X_test, y_test)
神经网络MLPClassifier的效果评估:
from sklearn.neural_network import MLPClassifier
params_nn = {'hidden_layer_sizes': (30,30,30),
'activation': 'logistic',
'solver': 'lbfgs',
'max_iter': 500}
model_nn = MLPClassifier(**params_nn)
model_nn, accuracy_nn, roc_auc_nn, coh_kap_nn, tt_nn = run_model(model_nn, X_train, y_train, X_test, y_test)
随机森林的效果评估:
from sklearn.ensemble import RandomForestClassifier
params_rf = {'max_depth': 16,
'min_samples_leaf': 1,
'min_samples_split': 2,
'n_estimators': 100,
'random_state': 12345}
model_rf = RandomForestClassifier(**params_rf)
model_rf, accuracy_rf, roc_auc_rf, coh_kap_rf, tt_rf = run_model(model_rf, X_train, y_train, X_test, y_test)
LightGBM的效果评估:
import lightgbm as lgb
params_lgb ={'colsample_bytree': 0.95,
'max_depth': 16,
'min_split_gain': 0.1,
'n_estimators': 200,
'num_leaves': 50,
'reg_alpha': 1.2,
'reg_lambda': 1.2,
'subsample': 0.95,
'subsample_freq': 20}
model_lgb = lgb.LGBMClassifier(**params_lgb)
model_lgb, accuracy_lgb, roc_auc_lgb, coh_kap_lgb, tt_lgb = run_model(model_lgb, X_train, y_train, X_test, y_test)
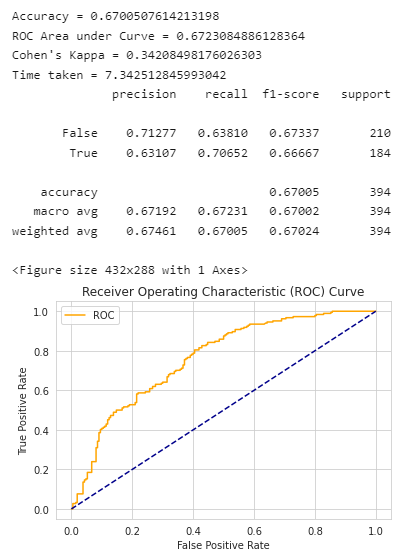
xgboost的效果评估:
import xgboost as xgb
params_xgb ={'n_estimators': 1000,
'max_depth': 128}
model_xgb = xgb.XGBClassifier(**params_xgb)
model_xgb, accuracy_xgb, roc_auc_xgb, coh_kap_xgb, tt_xgb = run_model(model_xgb, X_train, y_train, X_test, y_test)
各支球队世界杯时的排名:
world_cup_rankings = rank.loc[(rank['rank_date'] == rank['rank_date'].max()) &
rank['country_full'].isin(world_cup.index.unique())]
world_cup_rankings = world_cup_rankings.set_index(['country_full'])小组赛预测:
from itertools import combinations
opponents = ['First match \nagainst', 'Second match\n against', 'Third match\n against']
world_cup['points'] = 0
world_cup['total_prob'] = 0
for group in set(world_cup['Group']):
print('___Starting group {}:___'.format(group))
for home, away in combinations(world_cup.query('Group == "{}"'.format(group)).index, 2):
print("{} vs. {}: ".format(home, away), end='')
row = pd.DataFrame(np.array([[np.nan, np.nan, np.nan, True]]), columns=X_test.columns)
home_rank = world_cup_rankings.loc[home, 'rank']
home_points = world_cup_rankings.loc[home, 'total_points']
opp_rank = world_cup_rankings.loc[away, 'rank']
opp_points = world_cup_rankings.loc[away, 'total_points']
row['average_rank'] = (home_rank + opp_rank) / 2
row['rank_difference'] = home_rank - opp_rank
row['point_difference'] = home_points - opp_points
home_win_prob = model_lr.predict_proba(row)[:,1][0]
world_cup.loc[home, 'total_prob'] += home_win_prob
world_cup.loc[away, 'total_prob'] += 1-home_win_prob
points = 0
if home_win_prob <= 0.5 - margin:
print(&#34;{} wins with {:.2f}&#34;.format(away, 1-home_win_prob))
world_cup.loc[away, &#39;points&#39;] += 3
if home_win_prob > 0.5 - margin:
points = 1
if home_win_prob >= 0.5 + margin:
points = 3
world_cup.loc[home, &#39;points&#39;] += 3
print(&#34;{} wins with {:.2f}&#34;.format(home, home_win_prob))
if points == 1:
print(&#34;Draw&#34;)
world_cup.loc[home, &#39;points&#39;] += 1
world_cup.loc[away, &#39;points&#39;] += 1___Starting group F:___
Belgium vs. Canada: Belgium wins with 0.85
Belgium vs. Morocco: Belgium wins with 0.77
Belgium vs. Croatia: Belgium wins with 0.67
Canada vs. Morocco: Morocco wins with 0.69
Canada vs. Croatia: Croatia wins with 0.78
Morocco vs. Croatia: Croatia wins with 0.69
___Starting group C:___
Argentina vs. Saudi Arabia: Argentina wins with 0.84
Argentina vs. Mexico: Argentina wins with 0.61
Argentina vs. Poland: Argentina wins with 0.74
Saudi Arabia vs. Mexico: Mexico wins with 0.81
Saudi Arabia vs. Poland: Poland wins with 0.71
Mexico vs. Poland: Mexico wins with 0.56
___Starting group A:___
Qatar vs. Ecuador: Ecuador wins with 0.61
Qatar vs. Senegal: Senegal wins with 0.75
Qatar vs. Netherlands: Netherlands wins with 0.85
Ecuador vs. Senegal: Senegal wins with 0.73
Ecuador vs. Netherlands: Netherlands wins with 0.84
Senegal vs. Netherlands: Netherlands wins with 0.73
___Starting group D:___
France vs. Denmark: France wins with 0.56
France vs. Tunisia: France wins with 0.77
France vs. Australia: France wins with 0.78
Denmark vs. Tunisia: Denmark wins with 0.65
Denmark vs. Australia: Denmark wins with 0.67
Tunisia vs. Australia: Australia wins with 0.55
___Starting group H:___
Portugal vs. Ghana: Portugal wins with 0.79
Portugal vs. Uruguay: Draw
Portugal vs. South Korea: Portugal wins with 0.63
Ghana vs. Uruguay: Uruguay wins with 0.84
Ghana vs. South Korea: South Korea wins with 0.74
Uruguay vs. South Korea: Uruguay wins with 0.58
___Starting group E:___
Spain vs. Germany: Draw
Spain vs. Japan: Spain wins with 0.65
Spain vs. Costa Rica: Spain wins with 0.72
Germany vs. Japan: Germany wins with 0.55
Germany vs. Costa Rica: Germany wins with 0.63
Japan vs. Costa Rica:
Draw
___Starting group B:___
England vs. Iran: England wins with 0.66
England vs. United States: England wins with 0.57
England vs. Wales: England wins with 0.65
Iran vs. United States: United States wins with 0.67
Iran vs. Wales: Wales wins with 0.58
United States vs. Wales: Draw
___Starting group G:___
Brazil vs. Serbia: Brazil wins with 0.80
Brazil vs. Switzerland: Brazil wins with 0.72
Brazil vs. Cameroon: Brazil wins with 0.87
Serbia vs. Switzerland: Switzerland wins with 0.68
Serbia vs. Cameroon: Draw
Switzerland vs. Cameroon: Switzerland wins with 0.65
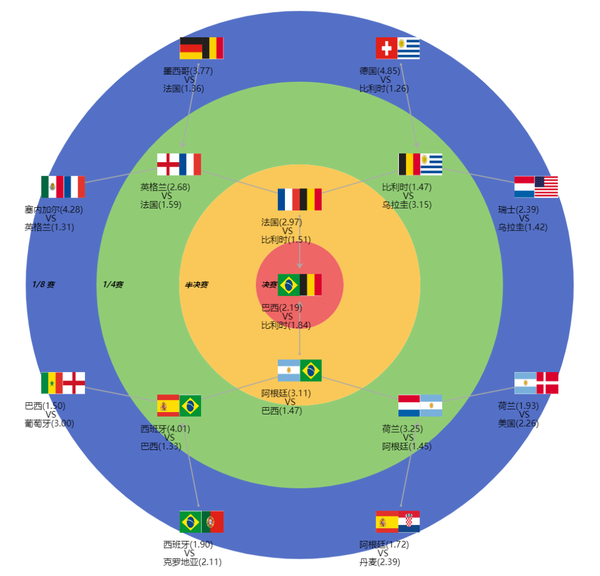
淘汰赛和总决赛预测:
pairing = [0,3,4,7,8,11,12,15,1,2,5,6,9,10,13,14]
world_cup = world_cup.sort_values(by=[&#39;Group&#39;, &#39;points&#39;, &#39;total_prob&#39;], ascending=False).reset_index()
next_round_wc = world_cup.groupby(&#39;Group&#39;).nth([0, 1]) # select the top 2
next_round_wc = next_round_wc.reset_index()
next_round_wc = next_round_wc.loc[pairing]
next_round_wc = next_round_wc.set_index(&#39;Team&#39;)
finals = [&#39;round_of_16&#39;, &#39;quarterfinal&#39;, &#39;semifinal&#39;, &#39;final&#39;]
labels = list()
odds = list()
for f in finals:
print(&#34;___Starting of the {}___&#34;.format(f))
iterations = int(len(next_round_wc) / 2)
winners = []
for i in range(iterations):
home = next_round_wc.index[i*2]
away = next_round_wc.index[i*2+1]
print(&#34;{} vs. {}: &#34;.format(home,
away),
end=&#39;&#39;)
row = pd.DataFrame(np.array([[np.nan, np.nan, np.nan, True]]), columns=X_test.columns)
home_rank = world_cup_rankings.loc[home, &#39;rank&#39;]
home_points = world_cup_rankings.loc[home, &#39;total_points&#39;]
opp_rank = world_cup_rankings.loc[away, &#39;rank&#39;]
opp_points = world_cup_rankings.loc[away, &#39;total_points&#39;]
row[&#39;average_rank&#39;] = (home_rank + opp_rank) / 2
row[&#39;rank_difference&#39;] = home_rank - opp_rank
row[&#39;point_difference&#39;] = home_points - opp_points
home_win_prob = model_lr.predict_proba(row)[:,1][0]
if model_lr.predict_proba(row)[:,1] <= 0.5:
print(&#34;{0} wins with probability {1:.2f}&#34;.format(away, 1-home_win_prob))
winners.append(away)
else:
print(&#34;{0} wins with probability {1:.2f}&#34;.format(home, home_win_prob))
winners.append(home)
labels.append(&#34;{}({:.2f}) vs. {}({:.2f})&#34;.format(world_cup_rankings.loc[home, &#39;country_abrv&#39;],
1/home_win_prob,
world_cup_rankings.loc[away, &#39;country_abrv&#39;],
1/(1-home_win_prob)))
odds.append([home_win_prob, 1-home_win_prob])
next_round_wc = next_round_wc.loc[winners]
print(&#34;\n&#34;)___Starting of the round_of_16___
Netherlands vs. United States: Netherlands wins with probability 0.52
Argentina vs. Denmark: Argentina wins with probability 0.58
Spain vs. Croatia: Spain wins with probability 0.53
Brazil vs. Portugal: Brazil wins with probability 0.67
Senegal vs. England: England wins with probability 0.77
Mexico vs. France: France wins with probability 0.73
Germany vs. Belgium: Belgium wins with probability 0.79
Switzerland vs. Uruguay: Uruguay wins with probability 0.58
___Starting of the quarterfinal___
Netherlands vs. Argentina: Argentina wins with probability 0.69
Spain vs. Brazil: Brazil wins with probability 0.75
England vs. France: France wins with probability 0.63
Belgium vs. Uruguay: Belgium wins with probability 0.68
___Starting of the semifinal___
Argentina vs. Brazil: Brazil wins with probability 0.68
France vs. Belgium: Belgium wins with probability 0.66
___Starting of the final___
Brazil vs. Belgium: Belgium wins with probability 0.54
我们看到模型预测的结果,决赛将由夺冠热门巴西队对阵拥有卢卡库、阿扎尔、德布劳内等多名明星球员的比利时队,最终比利时队赢得冠军!(预测结果仅供参考,一切结果以实际为准)
最后我们贴上用SmartNoteBook创作的一幅淘汰赛晋级图:
《新语数据故事汇,数说新语》 科普数据科学、讲述数据故事,深层次挖掘数据价值。欢迎各位朋友投稿!
微信号|SnbDataStory
《新语数据故事汇,数说新语》
本文使用 文章同步助手 同步 |
|


 发表于 2023-3-10 12:02:45